In an experiment, we deliberately change one or more process variables (or factors) in order to observe the effect the changes have on one or more response variables. The (statistical) design of experiments (DOE) is an efficient procedure for planning experiments so that the data obtained can be analyzed to yield valid and objective conclusions.
Typical notions in DOE : X^Y
X : Levels
Y : Factors
For example, in the design of printing machine, the print quality (the output) is dependent on the pressure applied by the print rollers, printer ink density, paper in-feed rate. So, we have two levels and three factors.
The objective of above experiment could be for maximizing the print quality. Or the same could be for minimizing the ink consumption. Depending on the experiment objective, designer would read the DOE results accordingly
Let us consider the following variations in the settings.
Pressure applied by roller : 80(Low level : -1) & 100(High level :+1)
Printer ink density: 75 (Low level : -1) & 95(High level :+1)
Paper in-feed rate : 14 (Low level : -1) & 22(High level :+1)
So, we have two levels and three factors.
At the default setting (pressure applied by the print rollers =90, printer ink density=85, paper in-feed rate =18), the print quality is 80%.
In order to understand the effect of variations in settings for best quality, let us run the printer eight times to capture the print quality.
 Main effects plot
A main effect plot is a line, which shows the effect of a single factor( eg. pressure alone) at high and low levels (+1 & -1) on the outcome (print quality)
In other words, main effect of Yi = Average response when Yi at -1 level - Average response when Yi at +1 level
In the above example main effects plot for the pressure would be

Average print quality at pressure @ -1 Level would be : 85.5
Average print quality at pressure @ +1 Level would be : 75
Main effect would be 10.5
And similarly for the density

Average print quality at density @ -1 Level would be : 81
Average print quality at density @ +1 Level would be : 79.5
and Main effect would be 1.5 , which is much lesser than the effect of pressure
The interaction plot for Pressure vs Density would be

which shows there is interaction as the lines are not parallel
The data for the above graph is with pressure on the x-axis

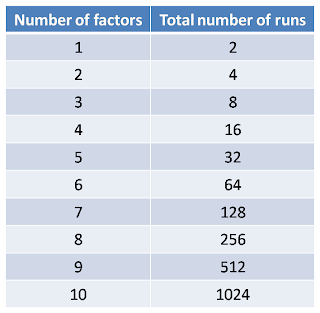
In an engineering environment, total number of runs --> number of prototypes to build

As one can see from above, for two level and four factor DOE, the total number of runs would be 16. If we change the levels from two to three, the runs would leap to 81. Performing such an experiment would be very expensive. So, always one would look for lesser runs without compromising the situation, which could be obtained by fractional factorial DOE
Typical notions in DOE : X^Y
X : Levels
Y : Factors
For example, in the design of printing machine, the print quality (the output) is dependent on the pressure applied by the print rollers, printer ink density, paper in-feed rate. So, we have two levels and three factors.
The objective of above experiment could be for maximizing the print quality. Or the same could be for minimizing the ink consumption. Depending on the experiment objective, designer would read the DOE results accordingly
Let us consider the following variations in the settings.
Pressure applied by roller : 80(Low level : -1) & 100(High level :+1)
Printer ink density: 75 (Low level : -1) & 95(High level :+1)
Paper in-feed rate : 14 (Low level : -1) & 22(High level :+1)
So, we have two levels and three factors.
At the default setting (pressure applied by the print rollers =90, printer ink density=85, paper in-feed rate =18), the print quality is 80%.
In order to understand the effect of variations in settings for best quality, let us run the printer eight times to capture the print quality.

A main effect plot is a line, which shows the effect of a single factor( eg. pressure alone) at high and low levels (+1 & -1) on the outcome (print quality)
In other words, main effect of Yi = Average response when Yi at -1 level - Average response when Yi at +1 level
In the above example main effects plot for the pressure would be

Average print quality at pressure @ -1 Level would be : 85.5
Average print quality at pressure @ +1 Level would be : 75
Main effect would be 10.5
 |
| Main Effect Plot - Pressure |

Average print quality at density @ -1 Level would be : 81
Average print quality at density @ +1 Level would be : 79.5
and Main effect would be 1.5 , which is much lesser than the effect of pressure
 |
| Main Effect Plot - Density |
The interaction plot for Pressure vs Density would be

which shows there is interaction as the lines are not parallel
The data for the above graph is with pressure on the x-axis

As we are running all the runs it would be called as full factorial DOE


As one can see from above, for two level and four factor DOE, the total number of runs would be 16. If we change the levels from two to three, the runs would leap to 81. Performing such an experiment would be very expensive. So, always one would look for lesser runs without compromising the situation, which could be obtained by fractional factorial DOE
No comments:
Post a Comment